Getting started with FacilityIQ™ begins with understanding which facilities, programs and performance questions matter most to your organization. Because the platform is designed around live site visibility, the first step is connecting each participating facility and tagging it to the appropriate market or program structure.
Rodan then pulls and normalizes the interval data so sites can be viewed together in one environment. Once that is in place, FacilityIQ™ can begin showing real-time performance, event overlays and portfolio-level visibility. If your organization is already enrolled in demand response programs, FacilityIQ™ is often a natural extension of that participation. For portfolio operators not yet in a program, Rodan can also discuss a standalone assessment.
This is also a good stage to decide how FacilityIQ™ will connect to the rest of your operating model. If your team needs peak alerts, PeakIQ™ may be relevant. If you need market visibility, MarketIQ™ adds context. If revenue validation matters, SettlementIQ™ supports the financial side.
The goal is not simply to install another dashboard. It is to give your team earlier, clearer visibility into what your facilities are doing and what that performance means.
Yes. One of the practical benefits of FacilityIQ™ is that it helps surface site performance issues before they become settlement disputes. In many organizations, the first sign of a problem shows up too late, after the event has passed and the financial impact is already locked in. At that point, your team is left explaining the result instead of preventing it.
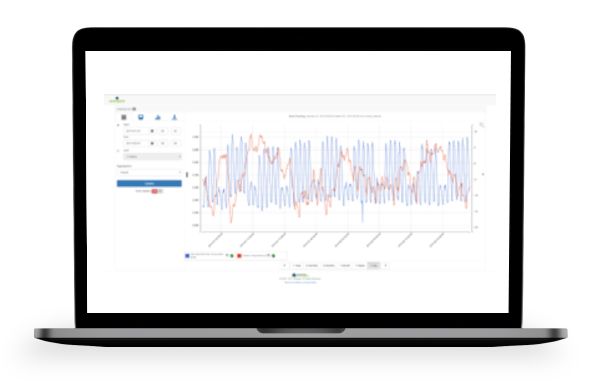
FacilityIQ™ changes that by giving you live site visibility with event windows overlaid onto facility consumption. If one site fails to respond as expected or deviates from its normal pattern during an event, the platform helps your team identify that earlier. That gives operations and portfolio managers the opportunity to investigate before the issue compounds.
This is especially important when your organization is earning revenue through demand response programs or validating outcomes through energy settlement services. Earlier issue detection can reduce revenue leakage, shorten dispute cycles and improve confidence in performance reporting.
When paired with energy demand management strategies and PeakIQ™ alerts, FacilityIQ™ becomes part of a larger operating model that helps teams respond sooner and settle more accurately.