Who it's for
MarketIQ™ is built for power traders, market analysts, generators, IPPs and C&I energy teams with direct exposure to the IESO.
- Energy Manager
- Energy Procurement
- Energy Trader
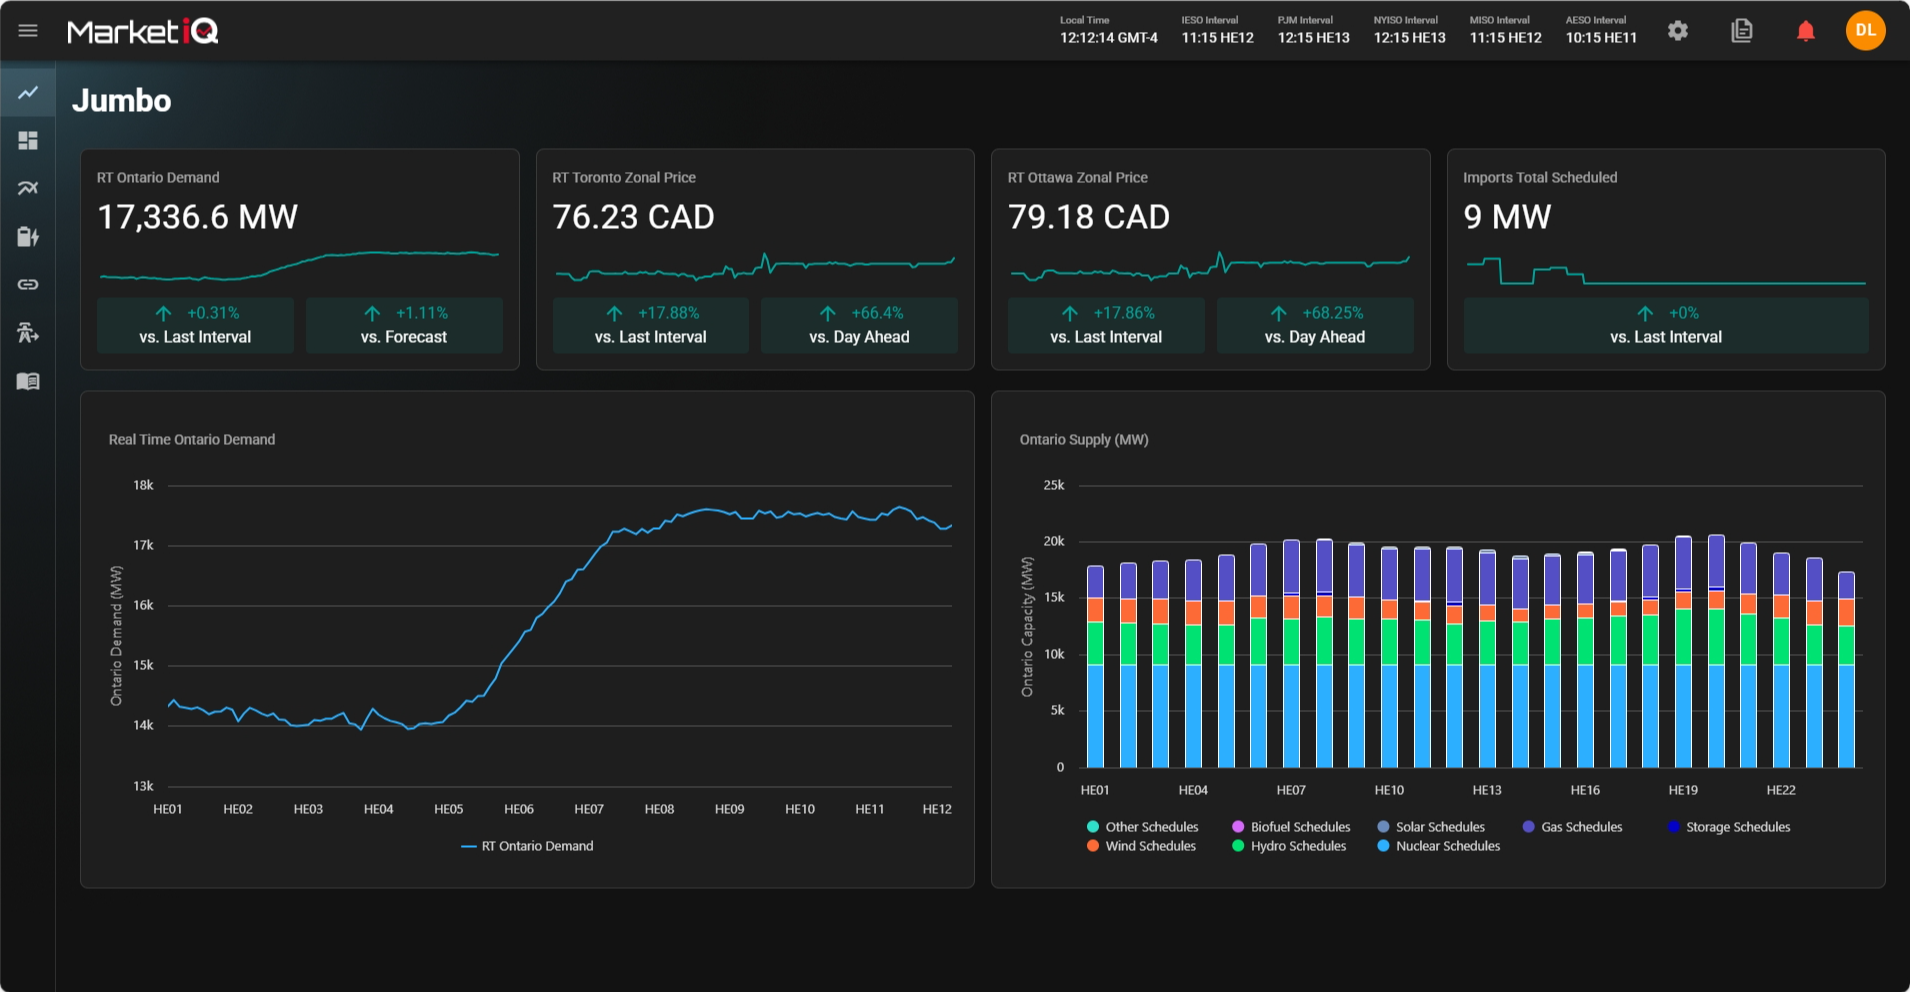
MarketIQ™ is Rodan’s Ontario market intelligence platform built to consolidate real-time IESO data into one operational view. Instead of pulling information from dozens of reports manually, you see the signals that matter in one place and act earlier.
MarketIQ™ is built for power traders, market analysts, generators, IPPs and C&I energy teams with direct exposure to the IESO.
You get one platform for real-time IESO power data, faster market visibility and earlier operational decision-making.
MarketIQ™ supports participants in Ontario’s Market Renewal Program. As MRP requirements evolve, the platform keeps pace, supporting data management, compliance readiness and operational decision-making.
MarketIQ™ brings Ontario market data together in a format your team can actually use. Instead of switching between reports, spreadsheets and dashboards, you get a single operational view that supports real-time decisions and better preparation.
Pricing, adequacy, generation, dispatch and intertie data are unified in one dashboard.
Real-time IESO power data is refreshed every five minutes for continuous visibility.
Access deeper historical market context to support analysis, forecasting and planning.
Critical advisories and market alerts are delivered through a central message console.
Faster preparation AND planning becomes easier when your team works from one source.
Rodan keeps the platform current so your team stays focused on decisions, not data cleanup.
See pricing, adequacy, generation and dispatch signals in one place instead of across multiple reports.
Act earlier on changing market conditions with five-minute updates and live signal visibility.
Give traders, analysts and operating teams access to the same market picture at the same time.
MarketIQ™ helps your team move from report gathering to faster interpretation. It gives you the data visibility needed to support trading, dispatch, planning and operational readiness across Ontario market activity.
See the full picture
Make confident decisions
Whether you’re an energy manager, financial analyst, or operations lead, MarketIQ™ has the tools you need.
Track facility performance, monitor market conditions, and optimize curtailment strategies in real-time.
Model revenue scenarios, analyze market trends, and generate reports for stakeholders.
Coordinate curtailment activities automatically.
Monitor real-time pricing, dispatch signals and intertie flows to support day-ahead and real-time trading decisions.
Explore other ways to maximize your energy assets with Rodan.
Use market intelligence to optimize your demand response strategy.
Real-time pricing data powers optimal charge/discharge decisions.
See how your assets contribute to our VPP across all markets.
Yes. MarketIQ™ can help teams involved in Ontario demand response participation by giving them clearer visibility into market conditions, adequacy, dispatch-related signals and the broader operating environment inside the IESO. While MarketIQ™ itself is not the execution layer, it improves readiness and interpretation.
Demand response performance depends on timing, awareness and coordination. If your team is working from fragmented reports, it becomes harder to prepare for changing conditions or understand the market context behind signals. MarketIQ™ brings that information together so your team can see more and prepare earlier.
For organizations actively participating in demand response programs, this improves operational awareness. If your team also needs event execution support, FlexOps™ helps manage dispatch activity. If you need to monitor how sites performed during an event, FacilityIQ™ provides that layer of visibility. If you want to validate revenue outcomes later, SettlementIQ™ helps confirm settlement accuracy.
So while MarketIQ™ does not replace participation management, it absolutely strengthens it. Better market awareness supports better preparation, and better preparation supports more reliable performance.
Getting started with MarketIQ™ is straightforward. Rodan offers a 30-day trial so your team can access the platform in a view-only environment and see how it fits your workflow before making a longer-term commitment.
That trial is useful because MarketIQ™ is best evaluated in the context of your actual market responsibilities. If your team currently pulls from multiple IESO reports, the value becomes obvious when you compare your current workflow to a single consolidated operating view.
The platform is especially relevant if you are already involved in Ontario dispatch, trading, generation monitoring, demand response participation or market analysis. It can also become more powerful when connected conceptually to other Rodan solutions. PeakIQ™ helps if your team is managing coincident peak risk. FacilityIQ™ is relevant if you need to connect market conditions to site-level performance. SettlementIQ™ adds value where settlement validation matters.
To begin, request the trial and let Rodan understand your use case. The goal is not just to give you access to data. It is to make sure your team can actually use it faster and better.
MarketIQ™ reduces manual report gathering by bringing dozens of IESO data sources into one platform with a single operating view. Instead of opening multiple reports, downloading spreadsheets and checking separate tabs for pricing, adequacy, generation and intertie activity, your team works from one environment.
That matters because manual gathering creates lag. It also creates inconsistency. One person may be looking at a refreshed report while another is still using an older version. When conditions are changing quickly, that delay affects decision quality.
MarketIQ™ addresses this by consolidating Ontario market information that is normally spread across 30 to 40 sources. Data is updated every five minutes, giving your team near real-time visibility without the overhead of constantly checking new files. That means less time collecting information and more time interpreting what it means.
For organizations that also use tools like PeakIQ™ for peak exposure, FacilityIQ™ for site visibility or SettlementIQ™ for validation, this consolidation improves cross-functional alignment. Everyone works from a more complete picture.
The result is not just convenience. It is faster preparation, cleaner workflows and better operational timing.
MarketIQ™ supports faster decisions by removing the delay between finding data and understanding what it means. In many organizations, decision speed is not limited by the availability of information. It is limited by how scattered that information is.
When pricing, adequacy, generation and dispatch signals are spread across multiple reports, your team loses time collecting, checking and aligning data before they can even begin interpreting it. MarketIQ™ solves that by consolidating Ontario market information into one operating view.
That means your analysts, traders or operators can move directly into interpretation. They spend less time gathering and more time deciding. Because the platform updates every five minutes, the information is also timely enough to support active decision-making.
This becomes even more valuable when fast decisions depend on coordination with other functions. For example, PeakIQ™ can translate market conditions into peak risk alerts for operations teams. FlexOps™ supports execution where action is required. FacilityIQ™ helps teams understand how facilities respond.
Faster decisions are not about moving recklessly. They are about reducing friction so your team can act while the information is still relevant.
A standard market dashboard typically displays a limited set of data points. It may be useful for quick reference, but it often leaves your team doing additional work to validate conditions, compare reports or gather missing context. MarketIQ™ is different because it is designed as a consolidated Ontario market intelligence platform, not just a display layer.
Instead of showing isolated charts, MarketIQ™ brings together pricing, adequacy, generation, dispatch and intertie information from dozens of IESO sources into one operating view. It is built for teams that need to make decisions, not just look at data.
Another difference is operational relevance. MarketIQ™ reflects the same kind of market intelligence Rodan uses internally to manage large-scale Ontario participation. That means the platform is built around real decision workflows, not just reporting convenience.
For organizations that need to connect market conditions with action, MarketIQ™ can work alongside PeakIQ™, ™and Demand Response. This lets your team move from visibility into execution without working across disconnected tools.
The difference is not cosmetic. It is the difference between a dashboard and a decision platform.
MarketIQ™ is updated every five minutes, which gives your team near real-time access to the Ontario market signals that influence operational and trading decisions. That update frequency is important because the value of market data declines quickly when it is stale.
If your team is pulling IESO reports manually, you are not just spending time gathering information. You are also creating timing risk. Different reports update at different intervals, and people often check them at different times. That means not everyone is working from the same picture of the market.
With MarketIQ™, pricing, adequacy, generation and dispatch-related information is refreshed continuously in one platform. That improves visibility and supports faster reaction when conditions change.
This becomes even more valuable when MarketIQ™ is used alongside other Rodan solutions. For example, PeakIQ™ helps your operations team act on peak-related signals, while FacilityIQ™ connects market conditions to site-level performance. If settlement accuracy matters, SettlementIQ™ supports validation after the fact.
Frequent updates are not just a technical feature. They are what allow your team to move from delayed interpretation to real operating readiness.
IESO power data refers to the operating and market information published by Ontario’s Independent Electricity System Operator. It includes pricing, demand, generation, adequacy, intertie flows, dispatch signals and other data points that influence how participants understand and respond to Ontario market conditions.
If your team works in the IESO, this information shapes daily decisions. Traders use it to interpret market movements. Generators and IPPs use it to monitor dispatch and system conditions. Large energy users with Ontario exposure use it to understand risk and timing. The challenge is that this data often lives across dozens of separate reports and feeds, which creates delays and inconsistency.
That is where MarketIQ™ fits. It consolidates IESO power data into one platform so your team sees the same operating picture without manually pulling from 30 to 40 sources. If you also manage peak exposure or demand-side participation, related tools such as PeakIQ™ and Demand Response can help turn that visibility into operational action.
When your team has a clearer view of market conditions, you prepare earlier and make faster decisions.
MarketIQ™ includes the core Ontario market signals teams need to understand conditions inside the IESO. That includes pricing, adequacy, generation, dispatch, intertie and transmission-related information, all brought together in one operating view.
For many teams, the challenge is that these data points are not difficult to find individually. The challenge is that they are spread across too many places. MarketIQ™ consolidates them so your team can assess what is happening in the market without switching between reports.
This matters whether you are supporting dispatch, planning bids, monitoring generation or managing facility exposure to Ontario market conditions. Instead of separating the data into isolated categories, MarketIQ™ helps you understand how these signals interact. That improves timing and gives operations, analysts and traders a shared picture of what matters.
If your organization also manages peak exposure, then PeakIQ™ can complement MarketIQ™ by turning market visibility into peak risk alerts. If your team is participating in programs tied to operational response, Demand Response and FlexOps™ extend that into execution.
MarketIQ™ is not just a dashboard. It is a consolidated view of the Ontario electricity market built for faster interpretation and earlier decisions.
An IESO power data platform is most useful for organizations that make operational, trading or planning decisions based on Ontario market activity. That includes power traders, market analysts, generators, IPPs, battery operators, demand response participants and large commercial or industrial energy teams with direct IESO exposure.
If your team currently pulls market information from multiple IESO reports, spreadsheets or browser tabs, a dedicated platform can reduce time spent gathering information and improve decision speed. In many organizations, the issue is not the absence of data. The issue is fragmentation. Different people are often working from different reports, refreshed at different times, with no single shared operating view.
MarketIQ™ solves that by consolidating live Ontario market data into one environment. It is especially useful when your team also needs to coordinate with energy demand management, energy settlement services or demand response programs. Instead of treating market data as separate from operations, you can connect the two.
If your decisions depend on IESO signals, pricing, adequacy or dispatch activity, an IESO power data platform is not just helpful. It becomes operational infrastructure.
Historical market context matters because current conditions make more sense when your team can compare them against what has happened before. Pricing moves, adequacy shifts, generation patterns and dispatch behavior are easier to interpret when they are viewed with context instead of in isolation.
If your team only sees the current moment, it becomes harder to determine whether a condition is normal, elevated or unusual. Historical depth helps analysts, traders and operators identify patterns, understand recurring behaviors and make better judgments about what a signal may mean.
MarketIQ™ includes deeper historical context than many competing platforms. That matters for teams working in the IESO because Ontario market behavior is often shaped by recurring demand patterns, supply constraints, intertie activity and changing system conditions.
Historical insight is also more useful when paired with complementary tools. If your organization is managing peak exposure, PeakIQ™ benefits from understanding prior peak behavior. If you are validating outcomes later, SettlementIQ™ relies on consistent data interpretation. If your team is trying to connect market conditions to operational performance, FacilityIQ™ adds facility-level visibility.
Historical data does not replace real-time visibility. It strengthens interpretation and improves confidence.
Still have questions? Contact our team